Case Study
Toyota Industries
Commercial Finance

Case Study
Toyota Industries
Commercial Finance

Data visualization and monthly dealer report automation for a captive finance company


“Rains Birchard delivered an elegant solution, designed on-brand, integrated with our existing platform. It’s the sort of creative problem solving that benefits our operations.”
— Bill Borris, Director – Marketing and Remarketing, Toyota Commercial Finance
The Problem
A growing dealer network created the need to better communicate individualized key metrics to the dealers on a routine basis
The Solution
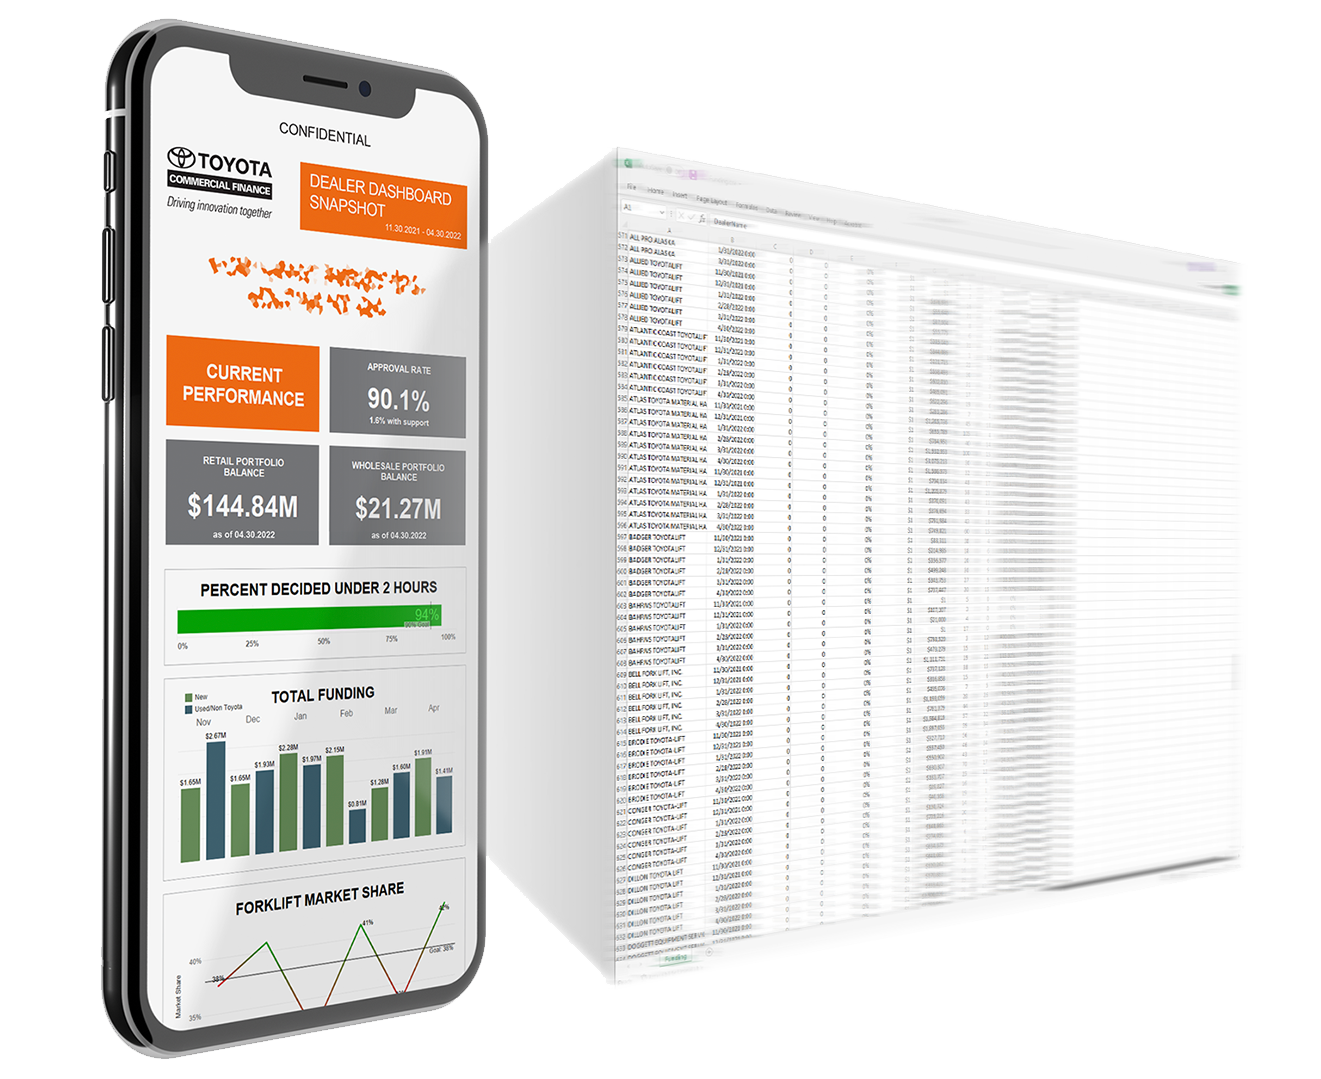
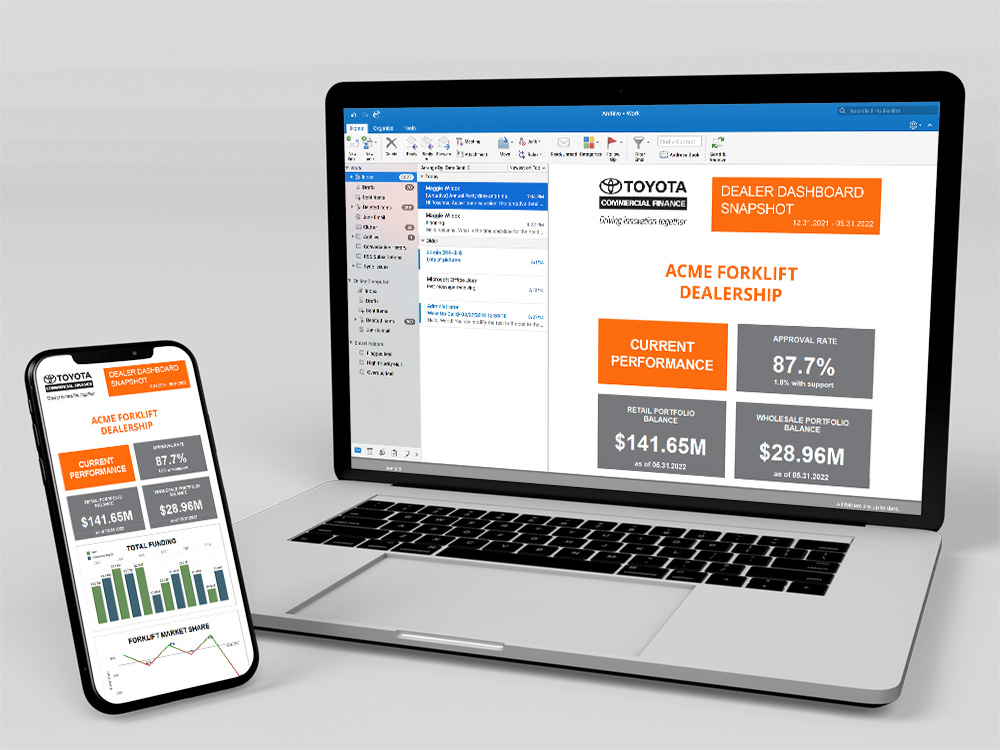
Developed a process to export data monthly, visualize the data points using custom scripted specialized software, then generate hundreds of customized e-mails through an e-mail marketing platform for distribution
The Result
Dealer feedback exceeded expectations. The customized reports have allowed Toyota Commercial Finance to work with individual dealers on goal achievement and performance tracking over time.
The Details
The North American dealer networks for both Toyota Forklifts and Hino Trucks were expanding. As a captive finance company, Toyota Commercial Finance (TICF) was — and is — dedicated to helping these dealers achieve their goals. To demonstrate the role strategic financing can play in enhancing dealer operations and profitability, TICF knew they needed to better communicate individualized key metrics to the dealers on a routine basis. However, they had no existing systems in place to do so.
To remedy this, we first consulted with TICF to understand the problem and desired outcome. We sought to understand the limitations of the existing databases and dealer communication channels, then embarked on a research phase to determine if an off-the-shelf solution existed that could be applied to the problem. Exploratory work determined that a custom solution was needed.
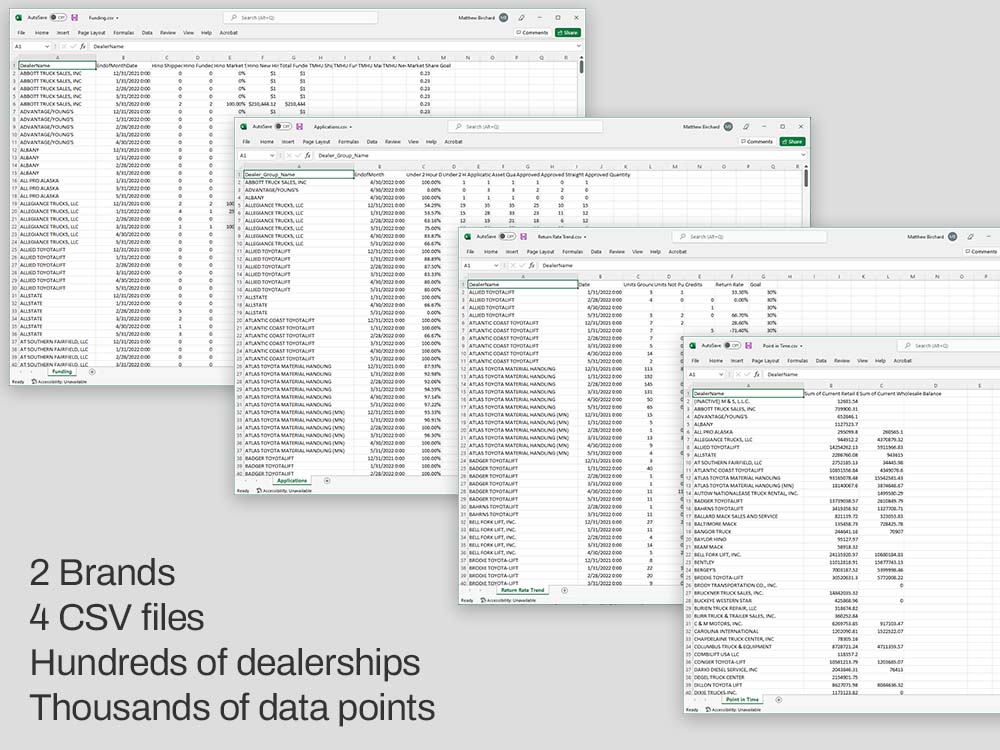
To start, we designed a prototype report that could be delivered via e-mail. This allowed us to settle on how the existing brand guidelines would apply to a new deliverable that was not specifically covered by the guidelines. Then, we guided TICF on a database query in their internal system, ultimately creating an export of the data set as a CSV file.
Next, we used the data visualization software Tableau to generate individual graphics for each of the dozen or so metrics we intended to report on monthly. These were designed to be able to be reassembled as variable data in an e-mail. Mailchimp is the e-mail marketing platform used by TICF for dealer communications, so our work needed to be able to integrate with it.
Once the visualization phase was complete, we needed to figure out a way to automatically name each exported graphic. The two dealer bodies, Toyota Forklifts and Hino Trucks, each have different metrics they track, and the number of metrics tracked also varies. It was critically important that we only send the specific dealer their information. Developing a nomenclature for graphics keyed to a dealer name that would be repeatable ensured the system would be durable. After solving for the automated naming of the visuals, we faced the challenge of getting Mailchimp to properly assemble the individual e-mails using the graphics. Since Mailchimp didn’t offer a bulk file upload function — and uploading over a thousand individual graphics to the media library would be impractical — we used file transfer protocol (FTP) to upload the files to a hidden directory on a TICF domain. We then scripted each e-mail for Toyota Forklifts and Hino Trucks individually, and set them to pull the graphics in via a variable data function.
In testing, we discovered that in some instances, a dealer may not have any data reported for a particular metric, and this would “break” the e-mail. To fix this, we added additional logic to use a default or “n/a” graphic in those cases, and to simply not generate an e-mail if certain data was not provided.
The entire system is triggered by a set of 6 CSV files TICF exports on a set date each month. We then enable our automated data visualization process, and manually proof. We’ve elected to keep it this way in order to have confidence in the output.
After the initial launch, we worked with TICF to integrate additional customizations to allow for more flexibility, such as changes in goal lines in certain graphics graphics.
Dealer feedback exceeded expectations, and the customized reports have allowed Toyota Commercial Finance — particularly regional sales managers — to work with individual dealers on goal achievement and performance tracking over time.

